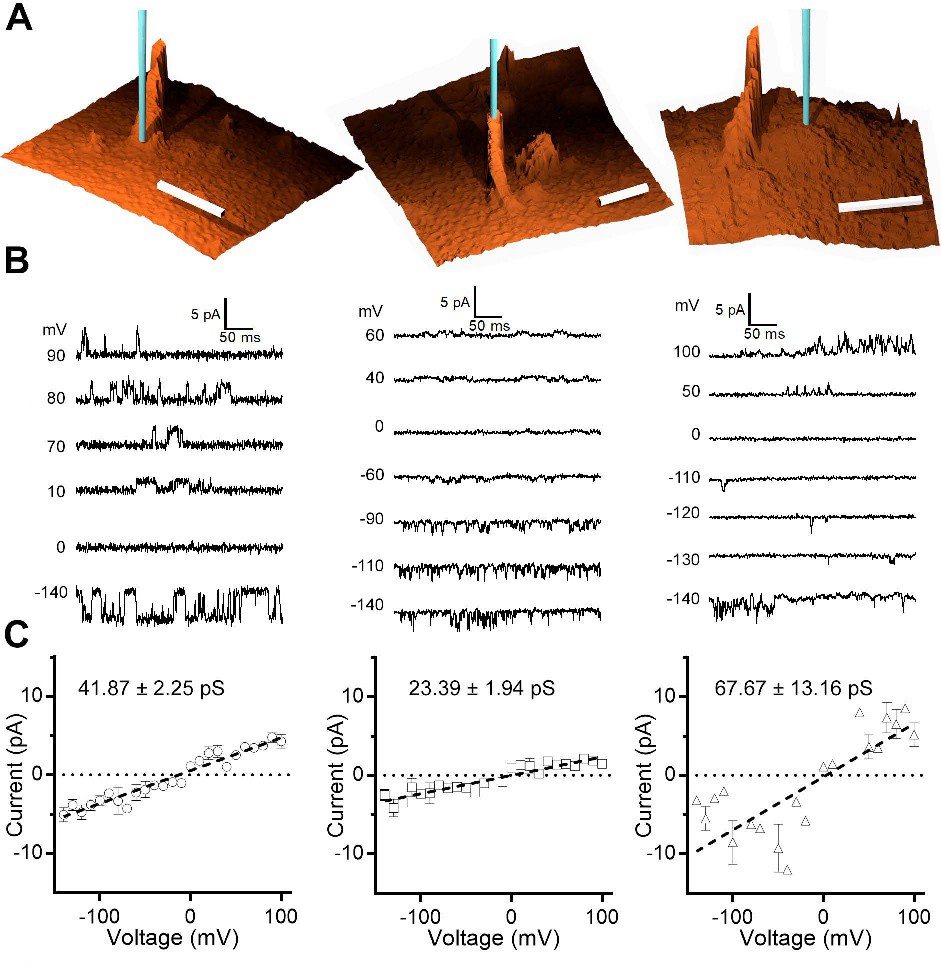
Fig. 2. Spatially resolved ion-channel recordings in primary cilia. Representative 3D topographical images of primary cilia (A) illustrating positioning of nanopipette (shown in blue) at the base of a cilium (left), tip (middle) and extra-ciliary membrane (right) to perform recordings. Scale bars 1 µm. Representative single-channel currents (B) recorded from the base of primary cilia (left), tip of cilia (middle), and extra-ciliary membrane (right). I/V curves of average (±SEM) single-channel current amplitudes (C) recorded at the base (left, n = 9), tip of cilia (middle, n = 6), and extra-ciliary membrane (right, n = 7). Voltages shown are nanopipette potentials against the ground electrode in the bath. All recordings shown were performed in the cell-attached mode.